
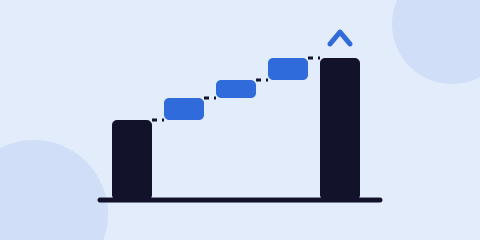
"AI will improve margins" isn't a value-creation plan. A plan names the lever, the P&L line it hits, the KPI that proves it, and the dollars. This guide maps specific AI and automation levers to revenue, gross margin, SG&A, and working capital in field service and energy infrastructure companies, walks through an illustrative EBITDA bridge, and shows how to estimate impact so it holds up in a board meeting and in exit diligence.
The short answer
- In field services, the biggest levers usually sit in technician productivity, first-time completion, booking conversion, and time to invoice.
- In energy infrastructure, they sit in quote speed, engineering cycle time, throughput, and milestone billing.
- Credible estimates start from a measured baseline, net out costs, apply an adoption ramp, and separate one-time cash from recurring EBITDA.
Start with core operations, not the back office
It's tempting to start with chatbots and document summaries because they're easy. But BCG's 2024 survey of 1,000 executives (BCG sells AI consulting) found that 62% of AI's value lies in core business functions, with support functions contributing the rest. The same survey found 74% of companies had yet to show tangible value from AI. In a technician-driven or production-driven business, the core is the field and the factory floor.
Field services: levers mapped to the P&L
| P&L line | Lever | KPI that proves it |
|---|---|---|
| Revenue | AI-assisted booking and after-hours intake; systematic recommendations, renewals, and memberships | Booking conversion, revenue per customer, renewal rate |
| Gross margin | Dispatch and routing suggestions; technician copilots with job history and equipment data | Jobs per technician per day, first-time completion, overtime hours |
| SG&A | Automated scheduling, documentation, invoicing, and reporting | Office hours per job, cost to serve |
| Working capital | Invoice generated at job completion; automated collections follow-up | Time to invoice, days sales outstanding |
Energy infrastructure: levers mapped to the P&L
| P&L line | Lever | KPI that proves it |
|---|---|---|
| Revenue | Specification and RFQ intelligence; retrieval of past designs to speed quoting | RFQ-to-quote time, quote volume, win rate |
| Gross margin | Constraint visibility and planning support; BoM automation; quality documentation | Throughput, rework rate, engineering hours per order |
| SG&A | Automated supplier follow-up, approvals, and management reporting | Hours spent on expediting and reporting |
| Working capital | Material and schedule risk signals; milestone and dispatch documentation on time | Inventory days, milestone billing lag, on-time delivery |
For a manufacturer with a full order book, the revenue lever is often capacity rather than demand. Faster engineering and fewer production delays let the same plant ship more, which is why throughput belongs next to quote speed.
An illustrative EBITDA bridge
The numbers below are illustrative, for a hypothetical field service platform with $100M in revenue, $12M in EBITDA (12%), $40M in direct technician labor, 200,000 jobs a year, and 40 back-office staff. Every assumption is shown so you can replace it with your own.
| Lever | Assumption and arithmetic | Annual EBITDA |
|---|---|---|
| Starting EBITDA | 12% of $100M | $12.00M |
| Booking conversion | +1% revenue = $1.0M × 45% contribution margin | +$0.45M |
| Dispatch and routing | Overtime and drive time down 1.5% of direct labor: $40M × 1.5% | +$0.60M |
| First-time completion | Repeat visits fall from 6% to 4.5% of jobs: 3,000 fewer visits × $150 cost each | +$0.45M |
| Back-office automation | Growth absorbed without 5 planned hires × $65K loaded cost | +$0.33M |
| Run costs | Software, hosting, and support for the above, assumed | −$0.30M |
| Run-rate EBITDA | $12.00M + $1.83M − $0.30M | $13.53M |
Illustrative only. Not a benchmark, a forecast, or a typical result. Contribution margin, unit costs, and improvement rates vary widely by company.
Two things sit outside the bridge. First, working capital: cutting time to invoice from five days to two lowers receivables by about 3 × ($100M ÷ 365) ≈ $0.82M. That's one-time cash, not recurring EBITDA, so don't add it to the bridge. Second, one-time build and rollout costs, which belong in the investment case, not the run rate.
At an illustrative 10x exit multiple, the $1.53M net improvement is worth about $15.3M of enterprise value. That multiplier is why lever-level rigor is worth the effort, and why a buyer's diligence team will test every line.
Illustrative assumptions from this guide.
View the data
| Lever | Annual EBITDA |
|---|---|
| Starting EBITDA | $12.00M |
| Booking conversion | +$0.45M |
| Dispatch and routing | +$0.60M |
| First-time completion | +$0.45M |
| Back-office automation | +$0.33M |
| Run costs | −$0.30M |
| Run-rate EBITDA | $13.53M |
How to estimate impact credibly
- Baseline first. Use 12 months of measured data for each KPI. If you can't measure it today, fix that before claiming improvement.
- Use a comparison group. Roll out to some branches or lines first and compare against the rest, adjusted for seasonality.
- Convert KPIs to dollars with your own unit economics. Use the company's contribution margin, loaded labor cost, and cost per visit, not industry rules of thumb.
- Apply an adoption ramp. If 60% of technicians use the tool in quarter one, credit 60% of the effect.
- Net out run costs. Subscriptions, hosting, support, and the people who maintain the system.
- Avoid double counting. Dispatch and first-time completion both free technician time. Count the hours once.
- Separate run rate from realized. Boards and buyers will ask which is which. Label both.
- Haircut the upside case. Keep unproven initiatives out of the base case until a pilot shows results.
This mirrors what leading sponsors already ask for. Bain, which advises PE firms, describes Vista Equity Partners requiring quantified benefits from generative AI initiatives in each portfolio company's annual operating plan.
We build these levers for field service and energy infrastructure companies, so weigh our view accordingly. You don't need us to size them, though. Use the template below with your portfolio company to score candidate levers, plan the first 100 days, and track each KPI from baseline to target.
Questions to test any AI value case
- Which P&L line does this lever hit? If the answer is "several," split it.
- What's the measured baseline? Show 12 months.
- Which unit economics convert the KPI to dollars? Use the company's own.
- Is the revenue lever demand-limited or capacity-limited? The answer changes the math.
- What adoption rate is assumed, and how is it tracked?
- Are run costs netted out?
- Is any benefit counted twice?
- Is one-time cash kept separate from recurring EBITDA?
Where to go from here
If you want help building a lever-by-lever value case for a portfolio company, tell us what the business does and where margin is leaking. You can also see how we approach the sector on our Field Services page and our Private Equity page.